
Graphing & Data Games for Kids — Free Last Radar 7+
 New from Dad4Kids
Clean YouTube for kids
For families with traditional values, hand-picked by parents.
Open →
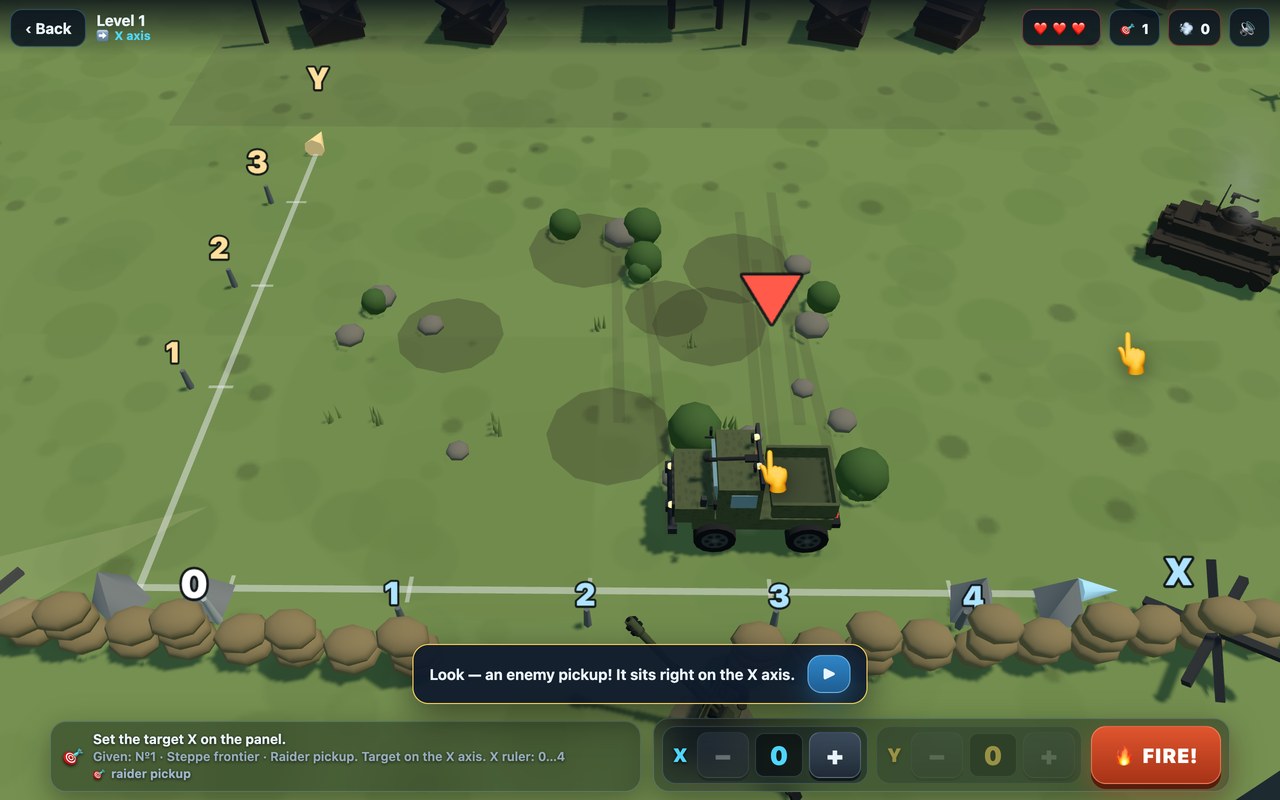
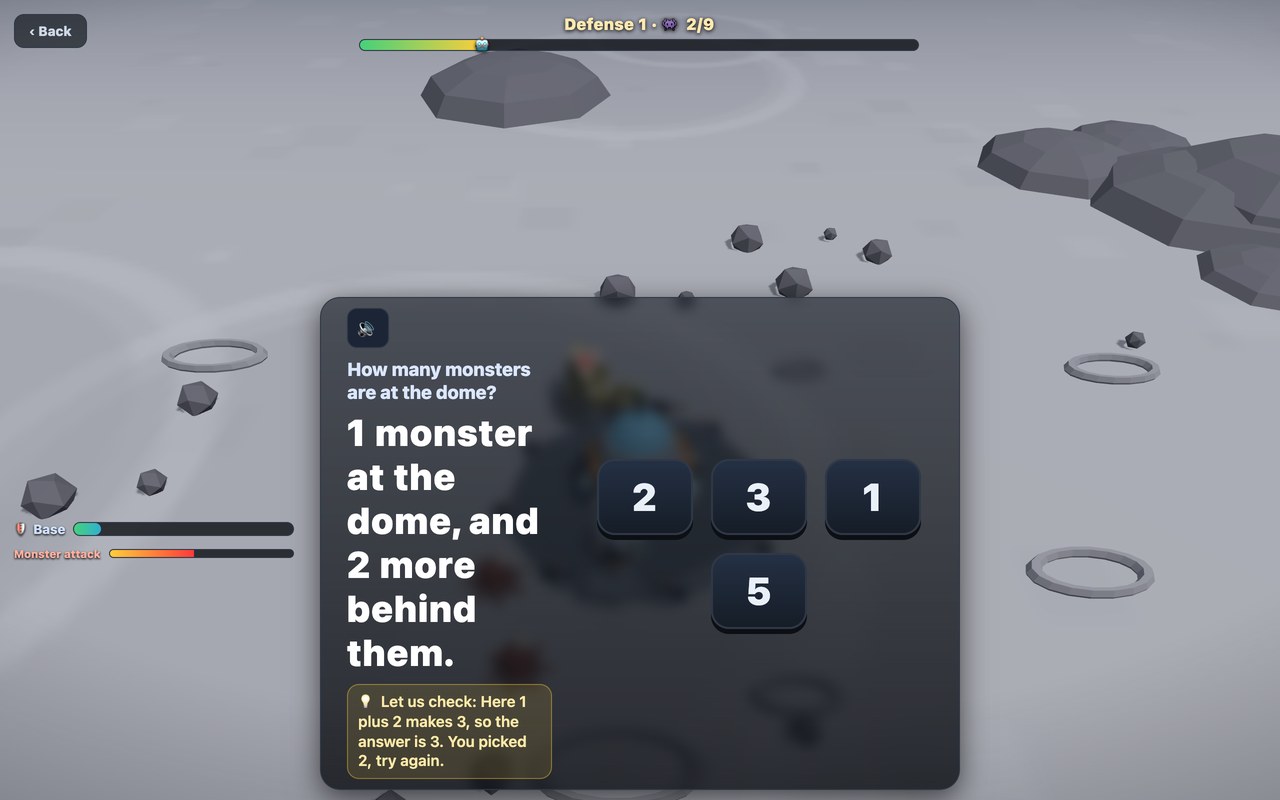
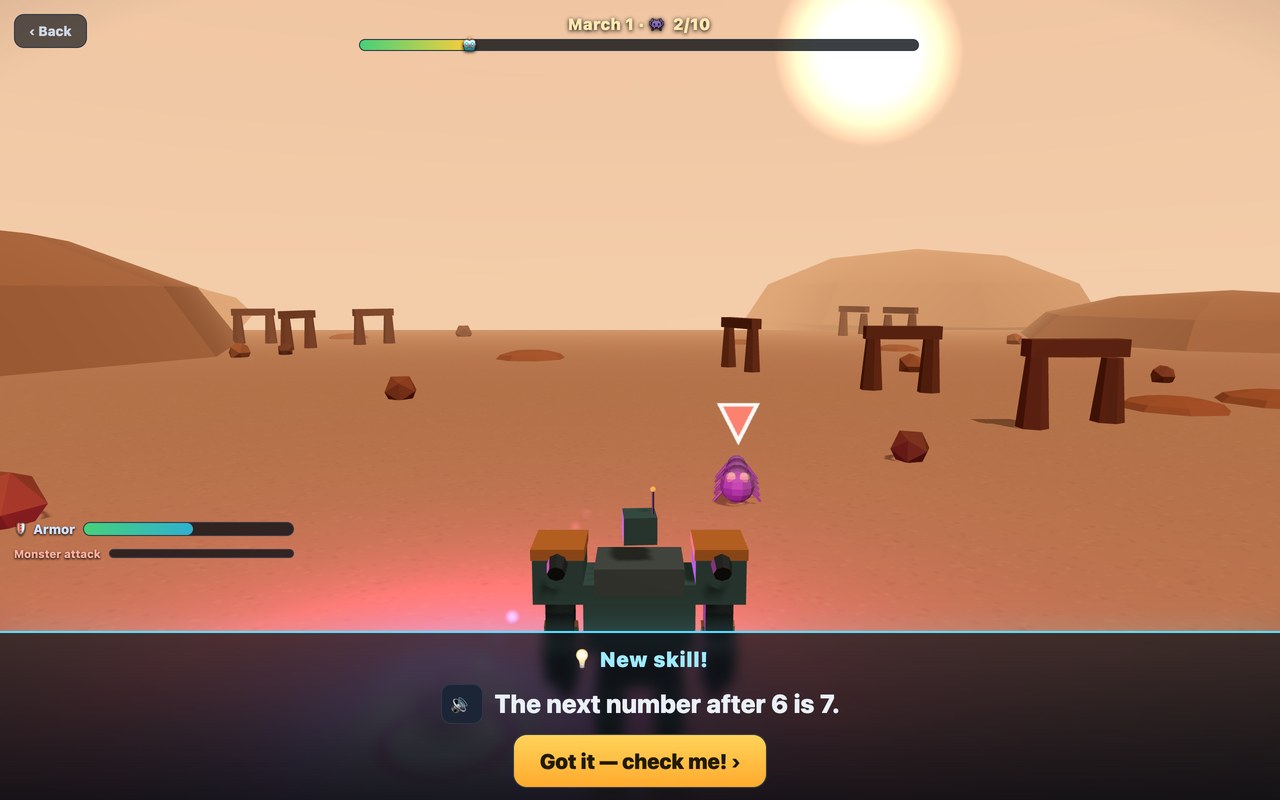
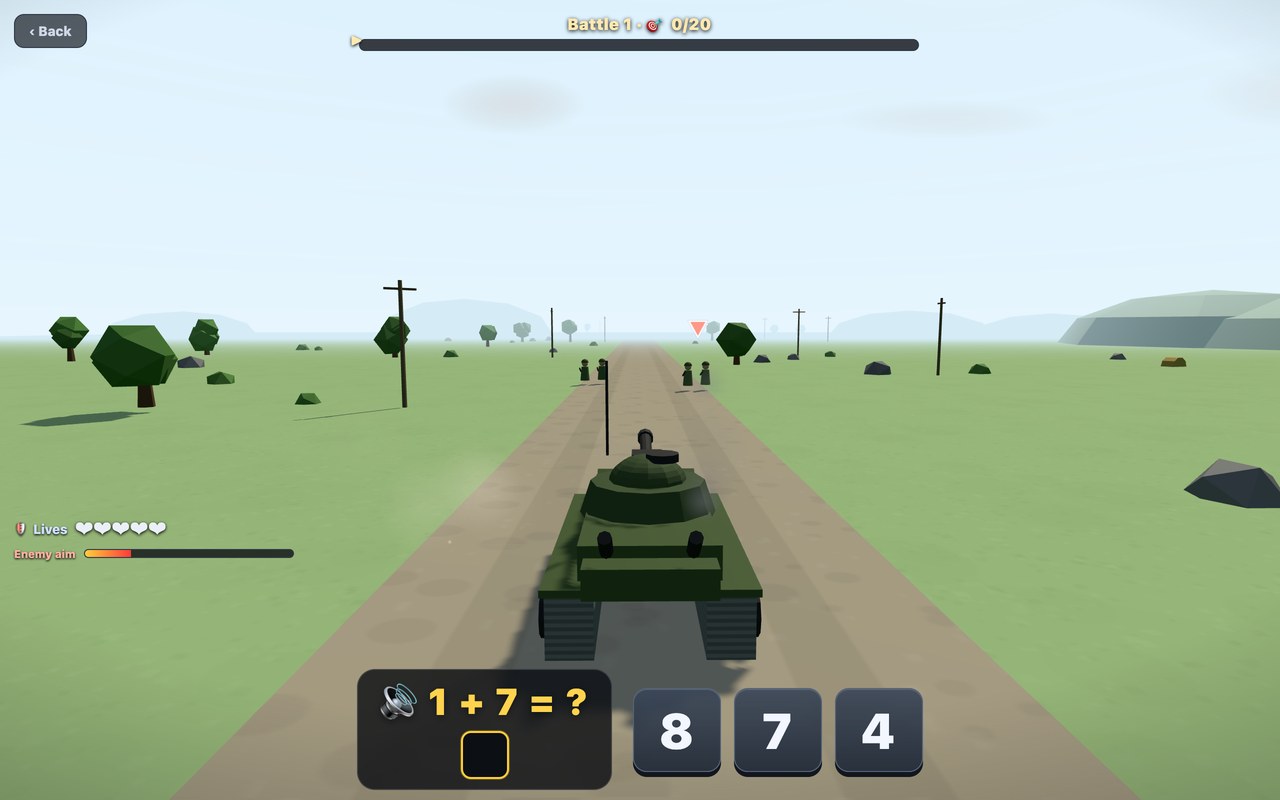
Last Radar is a set of graphing games for kids: charts, bar graphs, pictographs, tables and simple probability, all read to win the battle. On the radar base, every incoming wave is described by a chart, and the child reads it to know what is coming and how to get ready. Read the pictograph right and you know how many; read the bar chart's scale right and you know which lane is busiest. The data always matches what actually happens, so reading it correctly is what wins the day.
Ten campaigns build ten data skills, one at a time: counting and pictographs, bar charts and their scale, comparing parts of a whole, trends over time on a line graph, reading tables, averages, simple probability, samples, and spotting misleading graphs. Each campaign introduces its idea gently, then mixes it with the earlier ones across 500 levels.
How to play
Each level shows the data first: study the pictograph, bar chart, line graph, table or probability panel about the wave. Answer what the data says — how many, which is biggest, what the trend is, how likely — and prepare accordingly. Then watch it play out and compare your reading with what actually arrives. Reading the data correctly is rewarded; a misread is shown clearly so the child can fix it and try again.
What your child learns
A complete early data-handling path: reading pictographs and bar charts, scale divisions of 2/5/10, grouped and stacked charts, line graphs and change over time, one-way and two-way tables, mean, median, mode and range, probability as fractions and percentages, sample size and bias, and detecting misleading graphs (truncated axes, cherry-picked data). Children learn to pull real answers out of a chart — the heart of data literacy.
The science behind the games
Every Dad4Kids game is built on one simple truth: children want to play, not study — so we turn learning into a game worth replaying. The method draws on peer-reviewed research in game-based learning, motivation, and how memory works.
- Tokac et al. (2019). Effects of game-based learning on students' mathematics achievement: A meta-analysis. Journal of Computer Assisted Learning.
- Alotaibi (2024). Game-based learning in early childhood education: a systematic review and meta-analysis. Frontiers in Psychology.
- Lampropoulos & Sidiropoulos (2024). Impact of gamification on students' learning outcomes and academic performance: a meta-analysis. Education Sciences.
- Taylor & Boyer (2019). Play-based learning: evidence-based research to improve children's learning experiences. Early Childhood Education Journal.
- Gottfried (1990). Academic intrinsic motivation in young elementary school children. Journal of Educational Psychology.
- Yang et al. (2018). Enhancing learning and retrieval of new information: a review of the forward testing effect. npj Science of Learning.
FAQ
What data skills does it teach?
Reading pictographs, bar charts, line graphs and tables, comparing and averaging data, simple probability, and spotting misleading graphs — the core of elementary and middle-school data handling.
What age is it for?
Campaign 1 starts with one-symbol-one-thing pictographs a first-grader can read; by campaign 10 the game asks for multi-step reasoning with averages, samples and probability — comfortable through middle school.
Is it a shooting game?
No — the heart of every level is reading a chart correctly. The action is just the payoff: read the data right and the plan works out; misread it and the game shows you exactly where, so you can read it again.
More free games for kids
By Evgeny Arsentiev, PhD · Last updated: September 2026